Hill Diversity
Recent U.S. House Compensation and Diversity Survey Shows African Americans and Latina/os are Underrepresented Among Senior Roles
The Joint Center analyzed the diversity of House staff in personal offices who responded to the survey. The Joint Center’s analysis finds that:
- African Americans account for 13.4 percent of the U.S. population, but 11.5 percent of House personal office staff. However, African Americans are underrepresented in top roles (7 percent) such as chief of staff, legislative director, and communications director relative to the Black population. This latest number only reflects a .5% increase from two years ago.
- The U.S. House’s percentage of Latina/0 personal office staff (15.4 percent) is lower than the Latina/o population in the U.S. (18.5 percent). The disparity is even wider when comparing the percentage of Latina/os in senior roles (8.7 percent) such as chief of staff, legislative director, and communications director.
- The U.S. House’s percentage of white personal office staff (72.9 percent) is higher than the white population in the U.S. (60.1 percent). The gap is even wider when comparing the percentage of whites in top roles (79.5 percent) such as chief of staff, legislative director, and communications director.
- Asian Americans account for 5.9 percent of the U.S. population, but 5 percent of House personal office staff. However, they are almost proportionally represented when compared to the percentage of Asian Americans in senior roles (5.5 percent) such as chief of staff, legislative director, and communications director.
- The U.S. House’s population of Native American or Hawaiian (1.5 percent) is proportional to the Native American or Hawaiian population in the U.S. (1.5 percent). Similarly, they are almost proportionately in top roles (1.4 percent) such as chief of staff, legislative director, and communications director.
Charts reflecting our analysis can be found below.
Chart 1: Chief of Staff vs. House Staff and U.S. Population
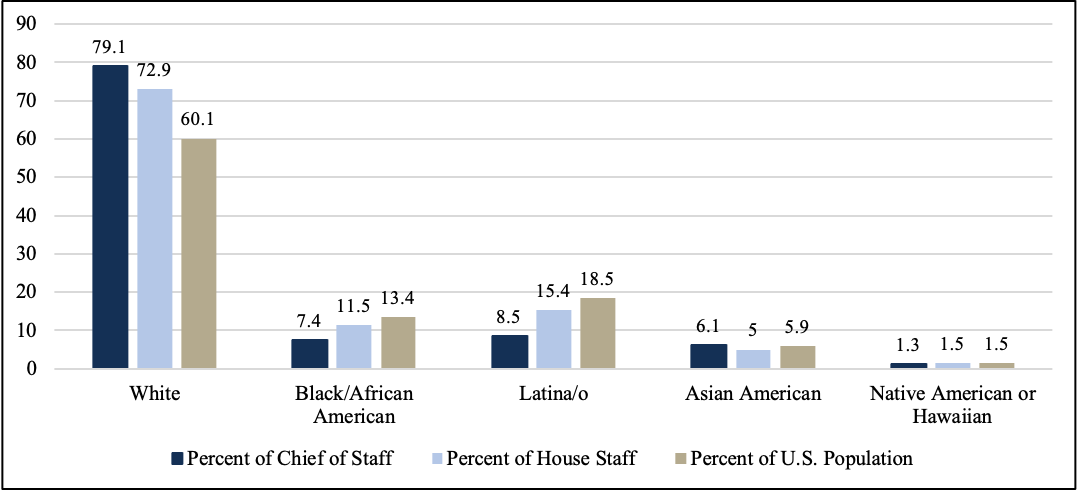
*We added Native American and Native Hawaiian categories from the survey to compare to the Census demographic data. Race and ethnicity questions are asked separately, so the percentages will not add up to 100%.
Chart 2: Legislative Director vs. House Staff and U.S. Population
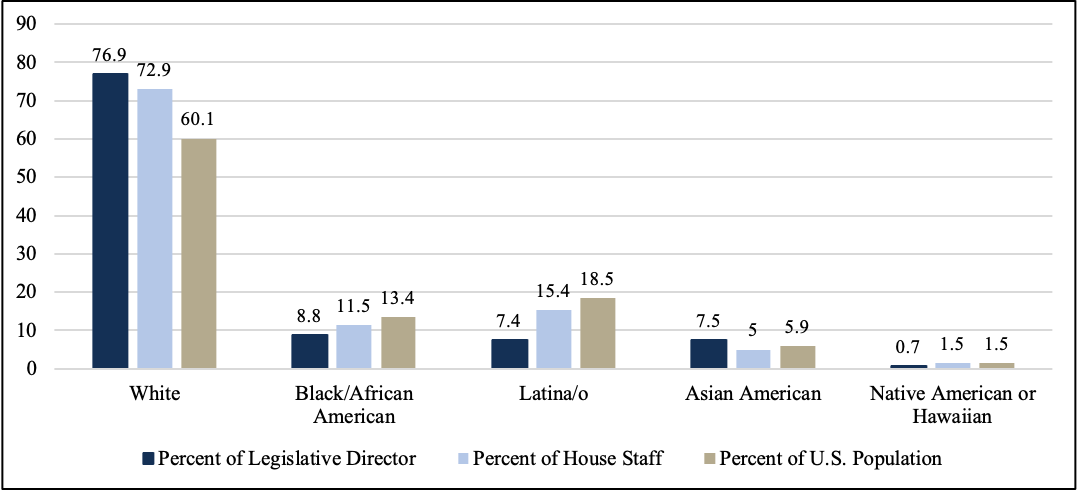
*We added Native American and Native Hawaiian categories from the survey to compare to the Census demographic data. Race and ethnicity questions are asked separately, so the percentages will not add up to 100%.
Chart 3: Communications Director/Press Secretary vs. House Staff and U.S. Population
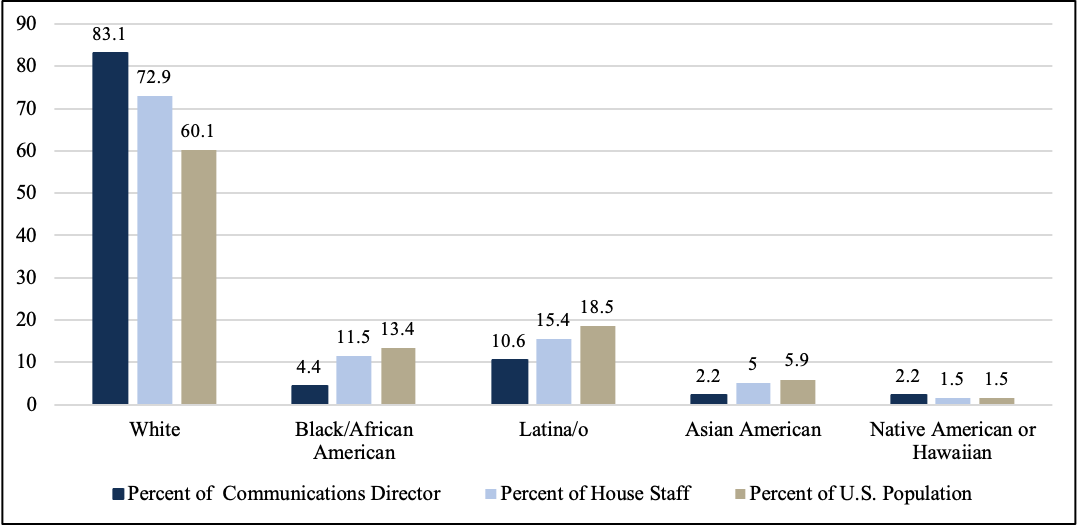
*We added Native American and Native Hawaiian categories from the survey to compare to the Census demographic data. Race and ethnicity questions are asked separately, so the percentages will not add up to 100%.
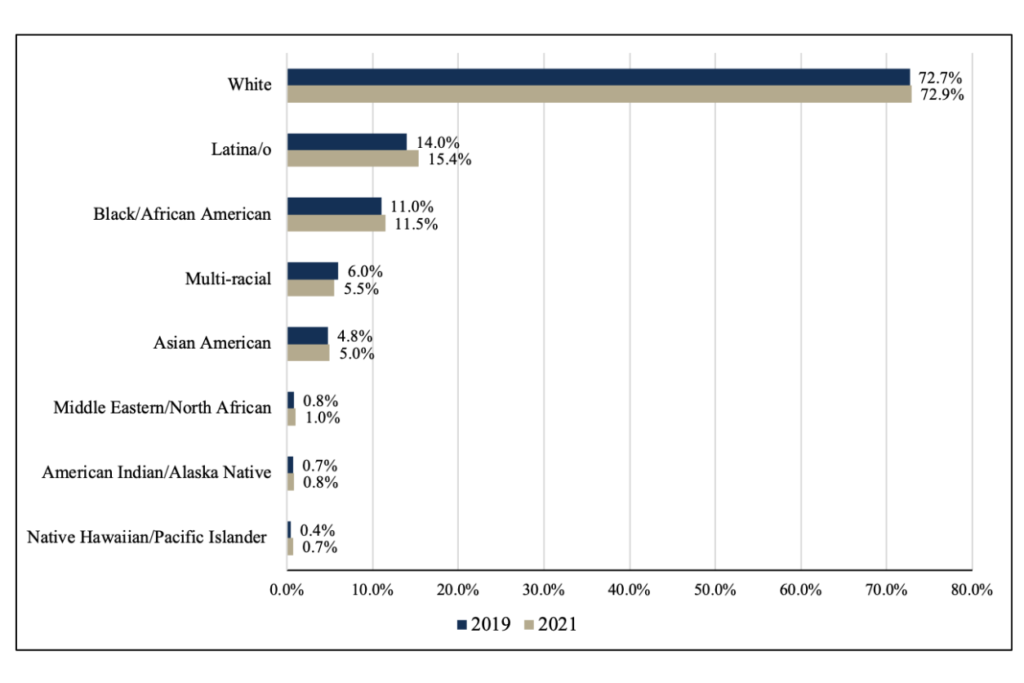
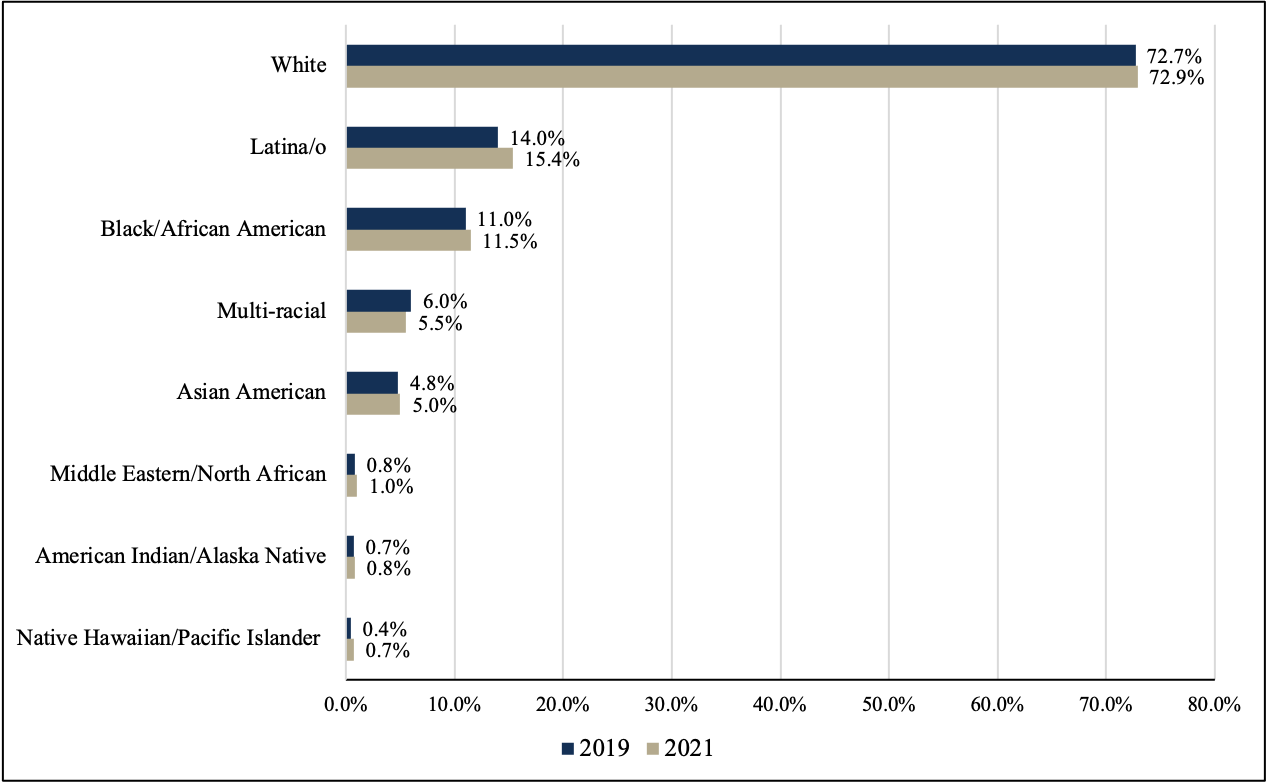
Chart 4: 2019 vs. 2021 House Personal Staff
The U.S. House Office of Diversity and Inclusion improved upon its previous report by including disaggregated data on diversity by position and asking respondents perceptions of their office climate. In our analysis of the ODI’s 2019 Compensation and Diversity Survey, the Joint Center called for the disaggregation of staff diversity by position, as presenting disaggregated data can reveal where the growth opportunities are for diversifying congressional staffers. In our analysis here, for example, we found that African Americans account for 13.4 percent of the U.S. population, but 11.5 percent of House personal office staff. However, the disparity is substantial when compared to the percentage of African American communication directors (4.4 percent). Regarding office climate in the U.S. House, 79.3 percent of staffers who participated in the survey believe their office culture to be inclusive. Almost 80 percent of survey respondents believe their office leadership values staffers with varied backgrounds and experiences.
ODI’s Compensation and Diversity Study is the most comprehensive report from the U.S. House on race, gender, and compensation. According to the survey results, House staffers, on average, receive equal pay for equal work regardless of gender, race, ethnicity, sexual orientation, and faith. The median salary for staffers in Member offices is $50,000. However, average salary differences may be attributed, in part, to job type. For Member Offices, representation of staffers of color is lower at senior-level positions when compared to junior-level positions. The finding of ODI’s survey is consistent with what Joint Center research has consistently demonstrated: congressional offices lack staff diversity at more senior levels.
ODI’s Compensation and Diversity Study comes after the Joint Center recommended that the House collect and disclose detailed demographic data in our 2018 report, Racial Diversity Among Top U.S. House Staff. Other Joint Center recommendations, such as creating an Office of Diversity & Inclusion and incorporating the “Rooney Rule,” have been adopted by the U.S. House of Representatives and Democratic Caucus, respectively.