Workforce Policy

July 2023 Jobs Day Analysis
The Joint Center analyzes the employment numbers from the Bureau of Labor Statistics and showcases how the numbers impact Black workers. Our July Jobs Day analysis is below.
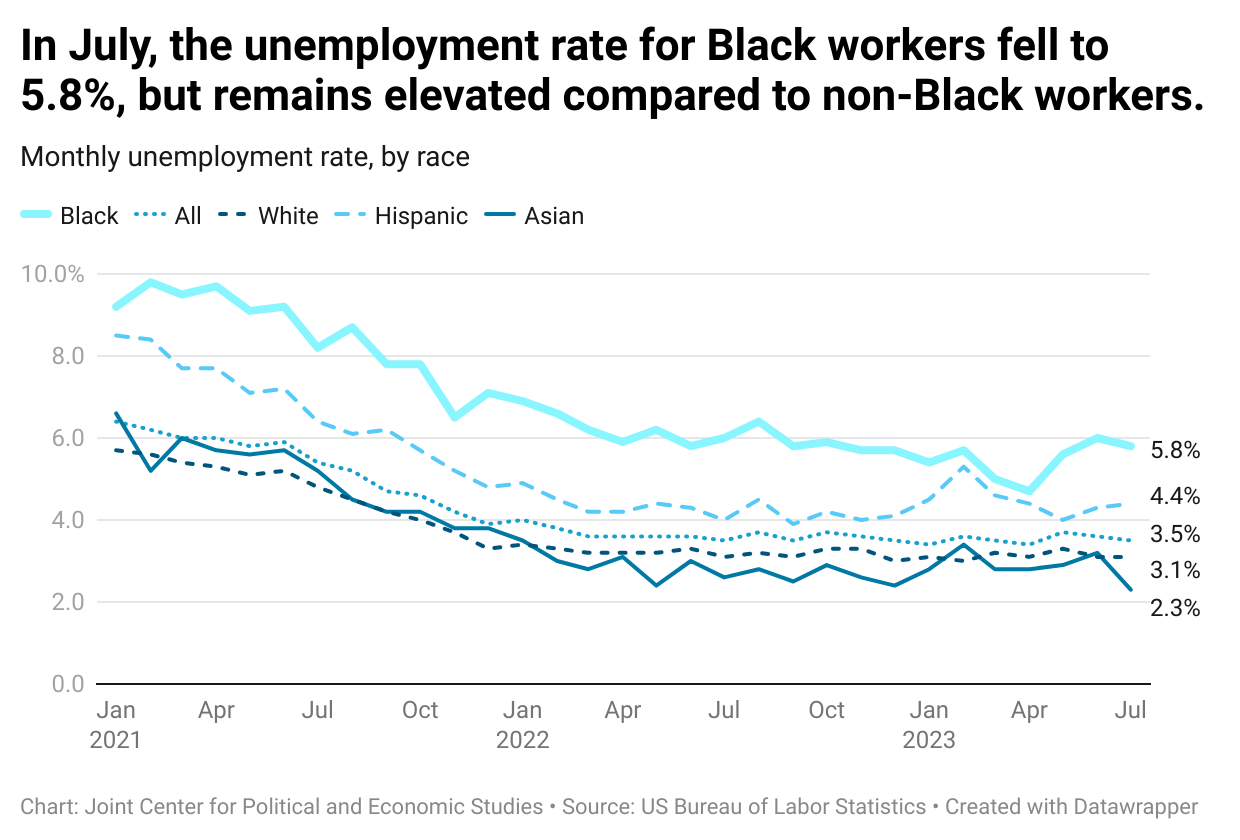
At 5.8 percent, July saw a slight rebound in the Black unemployment rate after increasing in May and June. The rate remains elevated compared to non-Black workers.
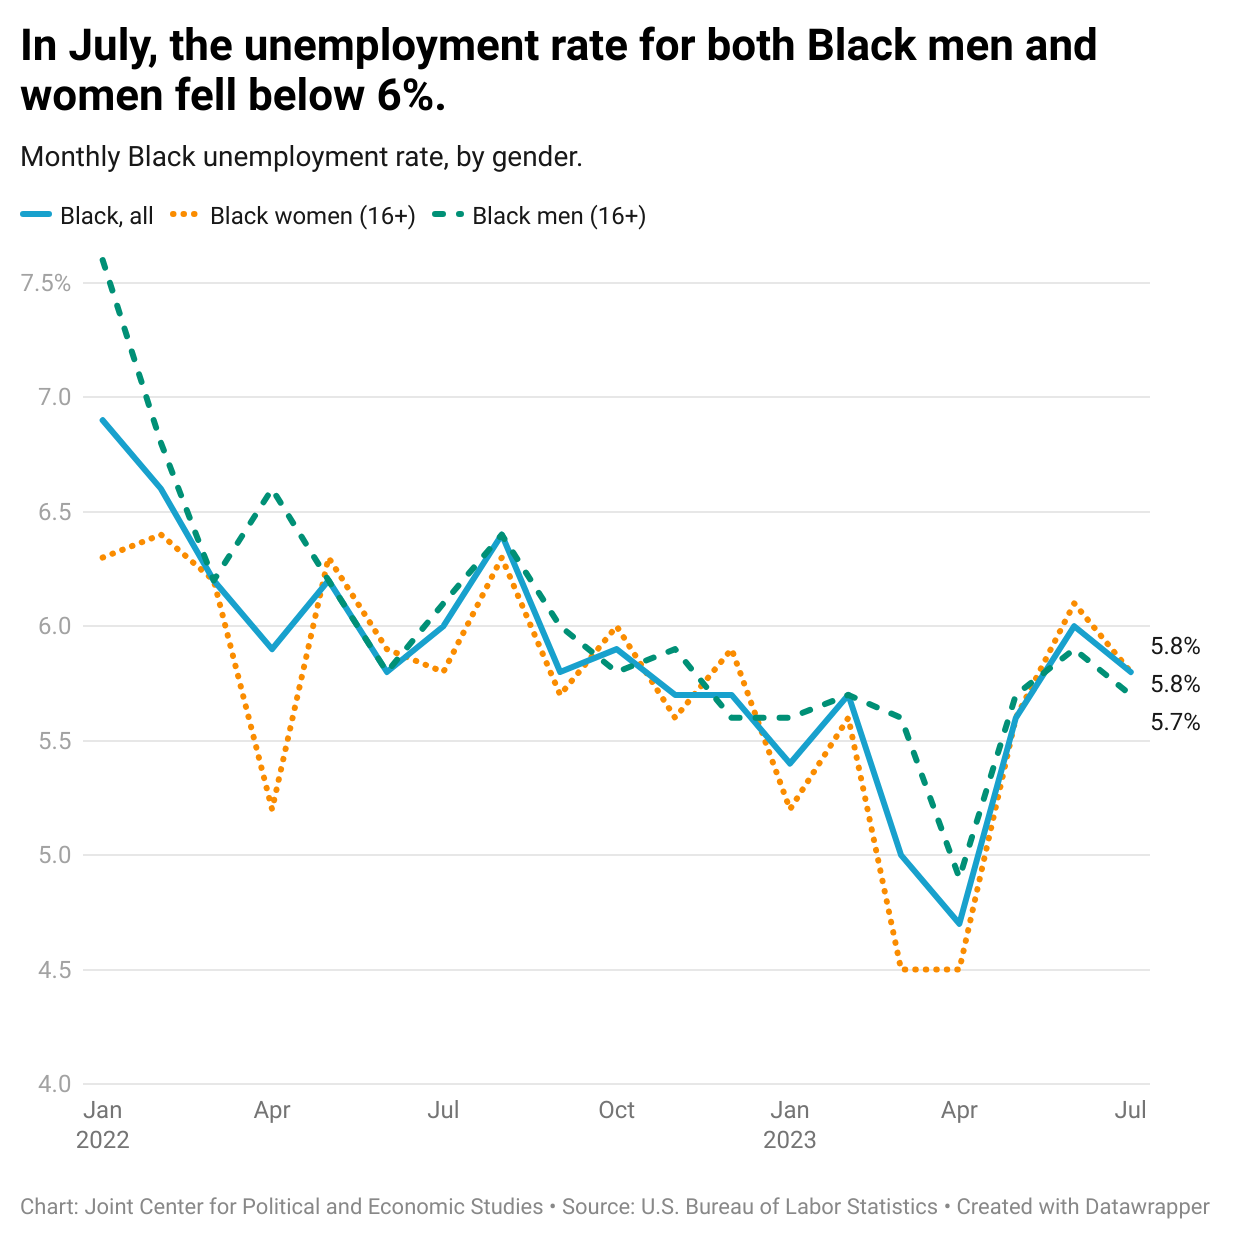
The unemployment rate for both Black women and men decreased in July.
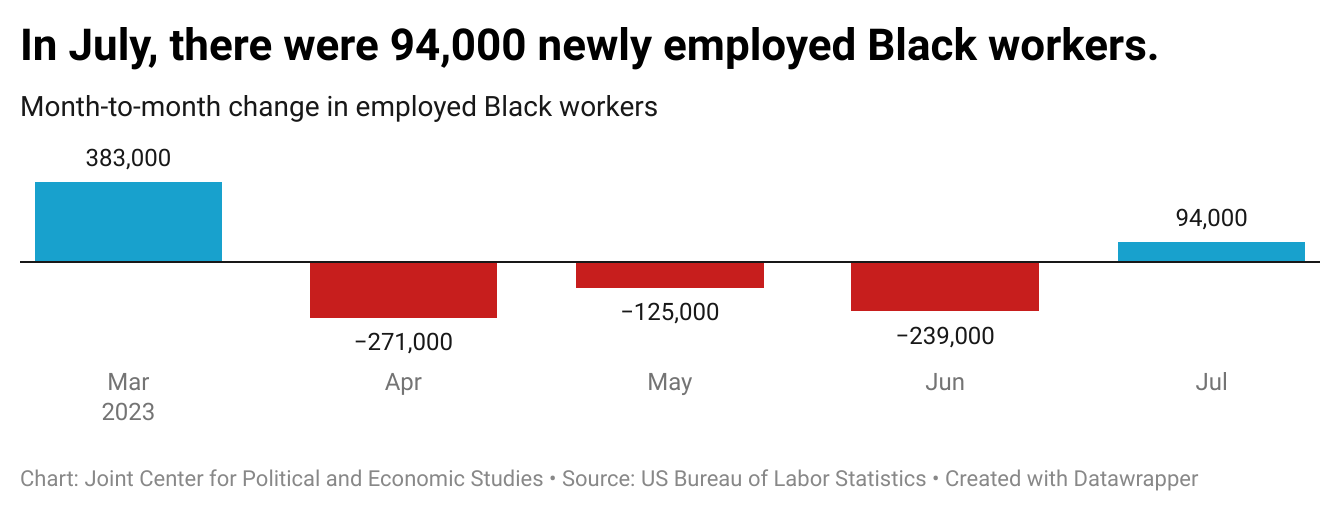
The number of Black workers increased by 94,000 in July, an increase in the number of employed Black workers for the first time since March.
Despite positive gains in employment numbers and a lower unemployment rate, there are still areas of concern for how the labor market is serving Black workers.
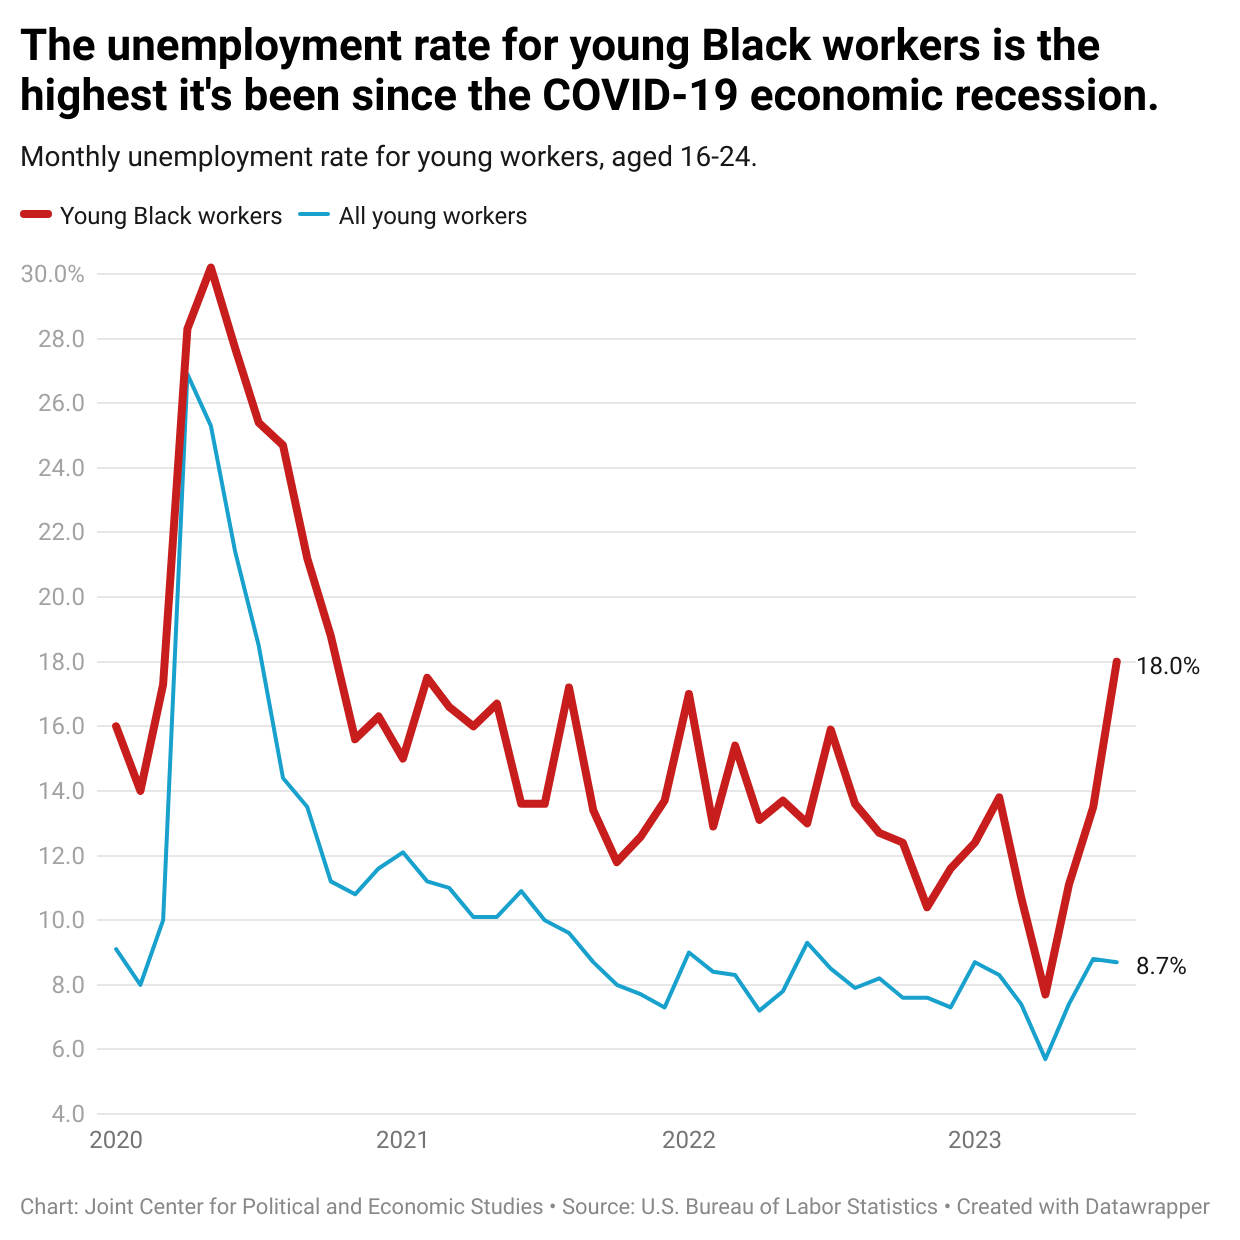
The unemployment rate for young Black workers increased for a third straight month to 18 percent. As the rate of young workers looking for jobs increases, fewer are able to find employment opportunities.
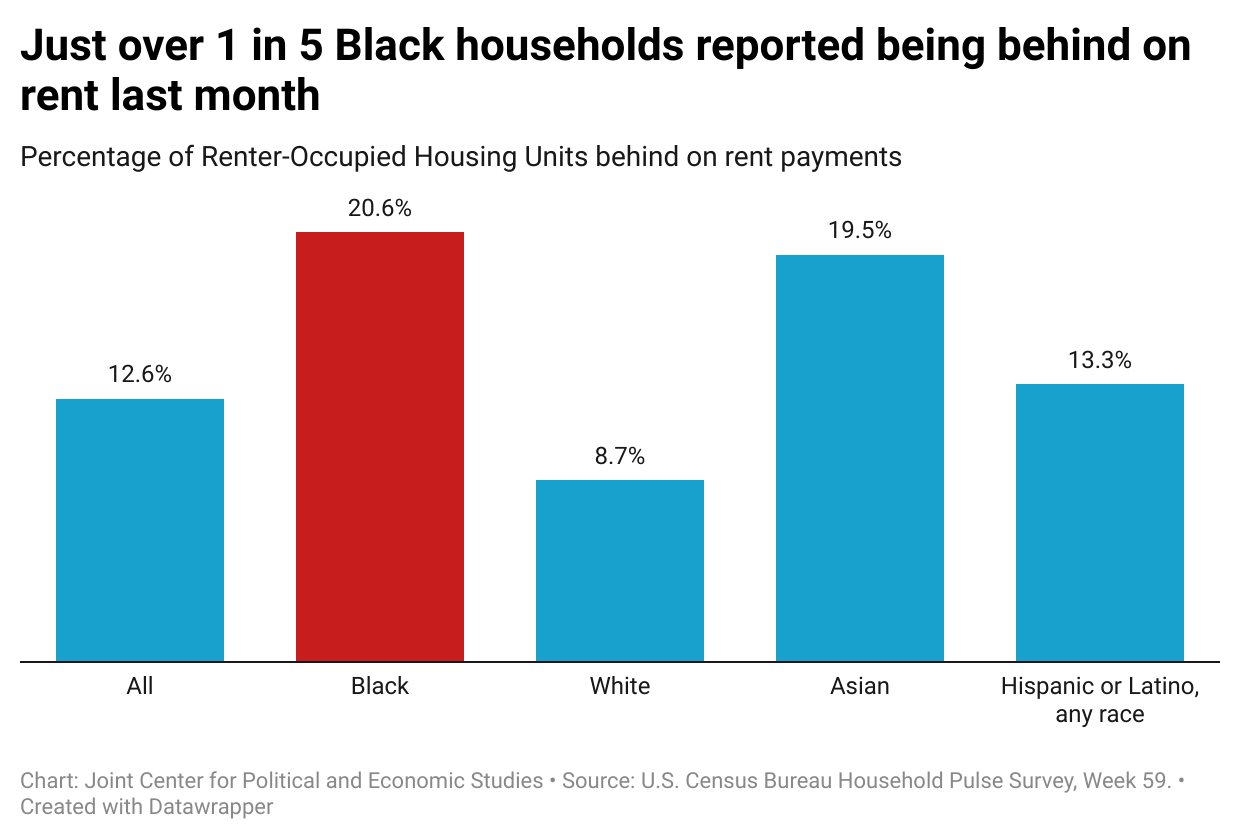
Additionally, many households are still struggling to cover the basics. 1 in 5 Black households still find themselves behind on rent.
And after several months of job loss for Black workers, a large racial gap exists between out of work workers denied unemployment insurance.
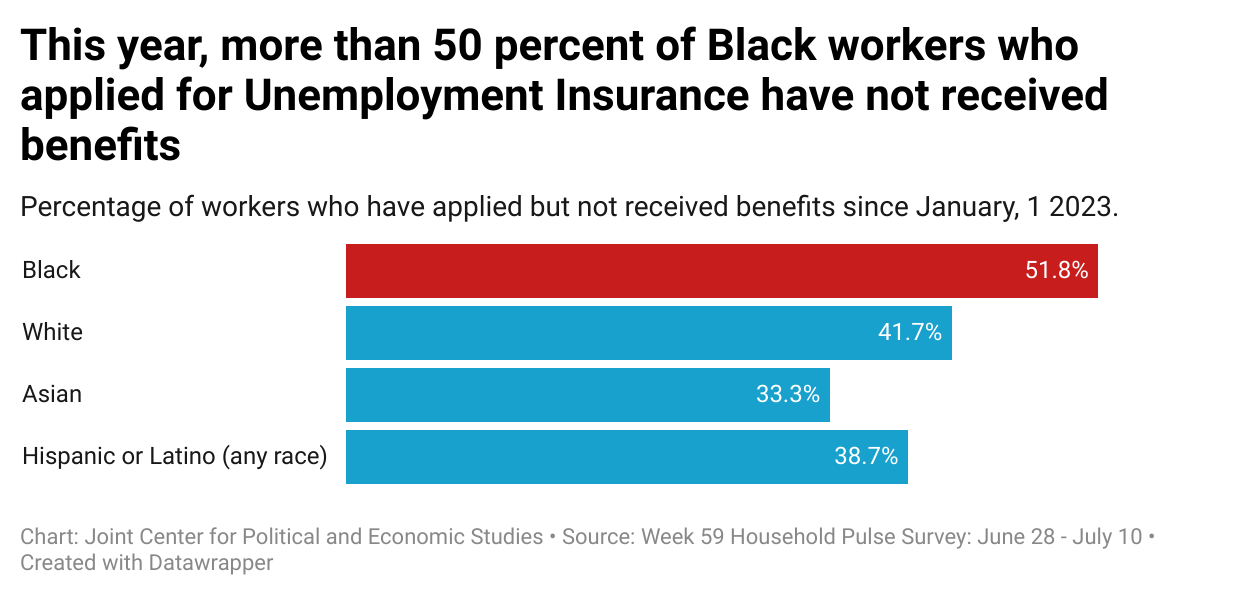
Additional research shows that Black workers are more likely to be denied benefits like Unemployment Insurance compared to white workers.
As the Federal Reserve Board balances lowering inflation, it is expected that hiring will slow. As that happens, it’s critical that Black workers have full access to work supports. Significant efforts must be made to erase the structural barriers that prevent Black workers from experiencing full employment.
Follow the Joint Center on X for monthly Jobs Day updates.


April 2024 Jobs Day Analysis