Hill Diversity
House-Wide Compensation and Diversity Study Shows African Americans and Latinos are Underrepresented Among Key Roles in Committee and Leadership Offices
On September 26, 2019, the U.S. House of Representatives released results from its study on diversity and compensation. The study is based on findings from a web-based survey on compensation, benefits, and demographics sent to all 10,356 House staff across all Member offices, committee offices, leadership offices, and House officer offices. Of all House staff, 51 percent (5,290) participated in the survey. The study does not disclose the partisan breakdown of survey respondents.
The Joint Center’s analysis finds that of those House staff in Committee and Leadership Offices who responded to the survey:
- The U.S. House’s percentage of Black staff in Committee and Leadership Offices (16.3 percent) is higher than the percentage of the Black population in the U.S. (12.3 percent). However, African Americans are underrepresented relative to the Black population in the U.S. in several key roles such as staff director/deputy staff director, communications director/press secretary, and senior policy advisor/policy advisor.
- Latinos are underrepresented among U.S. House Committee and Leadership Office staff. The U.S. House’s percentage of Latino staff in Committee and Leadership Offices (6.6 percent) is significantly lower than the percentage of the Latino population in the U.S. (18.3 percent). The disparity is even wider when compared to the percentage of Latinos in key roles such as staff director/deputy staff director, communications director/press secretary, and senior policy advisor/policy advisor.
- The U.S. House’s percentage of white staff in Committee and Leadership Offices (69.5 percent) is higher than the percentage of the white population in the U.S. (60.4 percent). The gap is even wider when compared to the percentage of whites in key roles such as staff director/deputy staff director, communications director/press secretary, and senior policy advisor/policy advisor.
- The U.S. House’s percentage of Asian American staff in Committee and Leadership Offices (8.4 percent) is higher than the percentage of the Asian American population in the U.S. (5.5 percent). Asian Americans are proportionately represented in key roles such as staff director/deputy staff director and communications director/press secretary, but underrepresented in senior policy advisor/policy advisor positions.
- The U.S. House’s percentage of Native American and Hawaiian staff in Committee and Leadership Offices (2.5 percent) is higher than the Native American and Hawaiian population in the U.S. (0.7 percent). Native Americans and Hawaiians are proportionately represented in key roles such as communications director/press secretary, but underrepresented in staff director/deputy staff director and senior policy advisor/policy advisor positions.
Similar findings were observed in our analysis of the racial diversity among personal offices in the U.S. House.
With regard to compensation, the survey found that House staffers “received equal pay for equal work regardless of gender, race, ethnicity, sexual orientation, and faith. Mean salary differences may be attributed, in part, due to job type.”
Charts reflecting our analysis can be found below.
Table 1: Committee and Leadership Office Diversity as Compared to Diversity of House Staff and U.S. Population
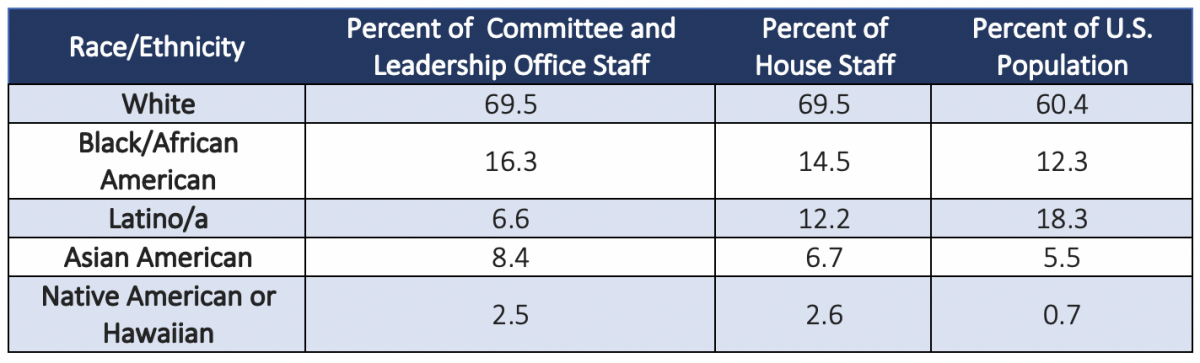
*We combined Native American and Native Hawaiian respondents from the survey to make a comparative analysis to the 2018 Census demographic data.
Table 2: Diversity of Staff Directors/Deputy Staff Directors as Compared to Committee and Leadership Office Diversity and U.S. Population
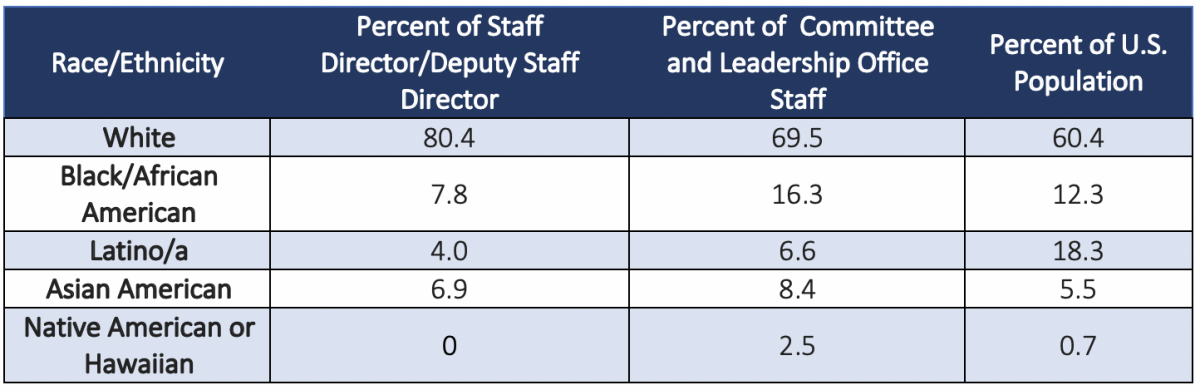
*We combined Native American and Native Hawaiian respondents from the survey to make a comparative analysis to the 2018 Census demographic data.
Table 3: Diversity of Communications Directors/Press Secretaries as Compared to Committee and Leadership Office Diversity and U.S. Population
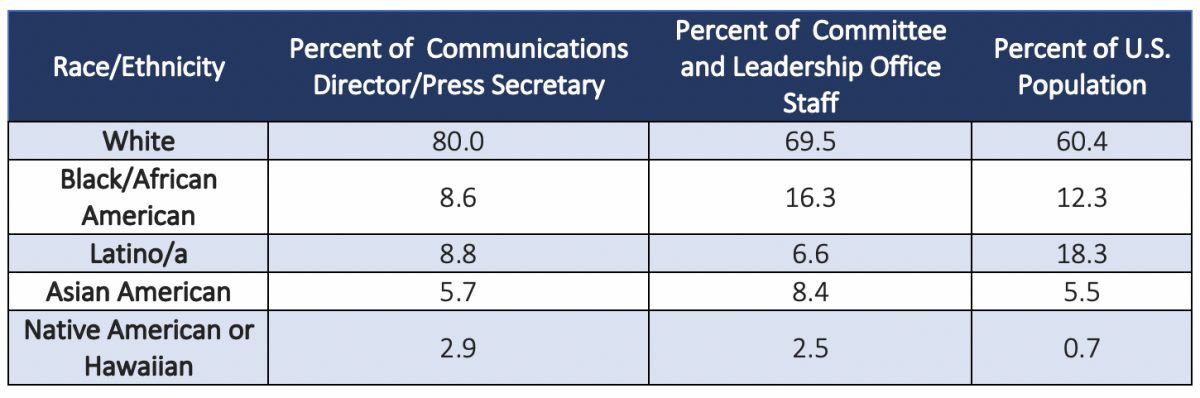
*We combined Native American and Native Hawaiian respondents from the survey to make a comparative analysis to the 2018 Census demographic data.
Table 4: Diversity of Senior Policy Advisors/Policy Advisors as Compared to Committee and Leadership Office Diversity and U.S. Population
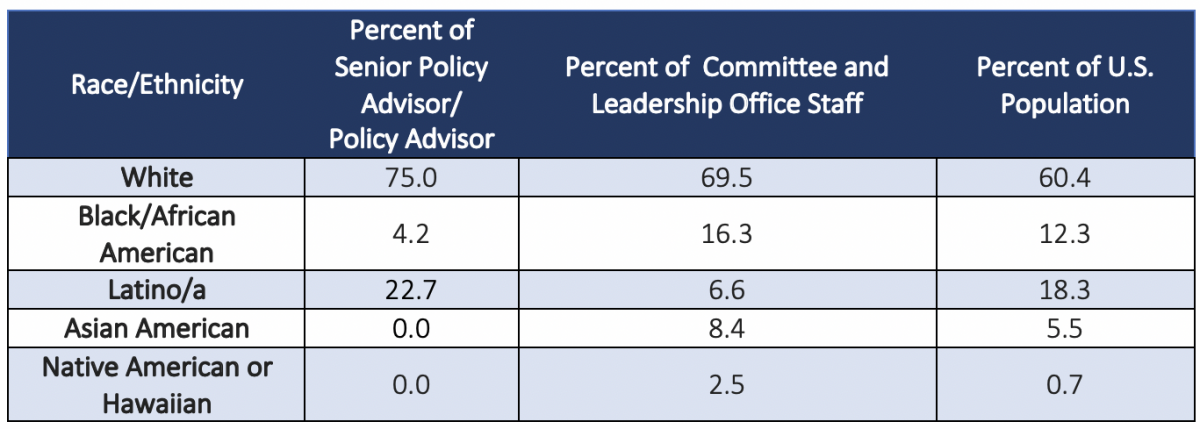
*We combined Native American and Native Hawaiian respondents from the survey to make a comparative analysis to the 2018 Census demographic data.
As we mentioned in our previous work, it is important to disaggregate congressional staff diversity by position and Member office. Presenting disaggregated data (e.g. separating staff director from deputy staff director) can show a more complete picture of the state of congressional staff diversity and reveal where the opportunities for growth are for committee and leadership staffers.
The Diversity and Compensation Study is the most comprehensive report from the U.S. House on race, gender, and compensation. The report comes after the Joint Center recommended that the House collect and disclose detailed demographic data in our 2018 report, Racial Diversity Among Top House Staff. Other Joint Center recommendations, such as the creation of an Office of Diversity & Inclusion and the incorporation of the “Rooney Rule,” have been adopted by the U.S. House and Democratic Caucus, respectively.
**Percentages in the tables above may not equal 100 percent because: 1). While the survey includes Middle Eastern and Other as options, the 2018 Census demographic data does not report this data in a comparable form; 2). Hispanic/Latino ethnicity was indicated in a separate survey item than race, and 3). individual respondents were able to select multiple races or ethnicities.