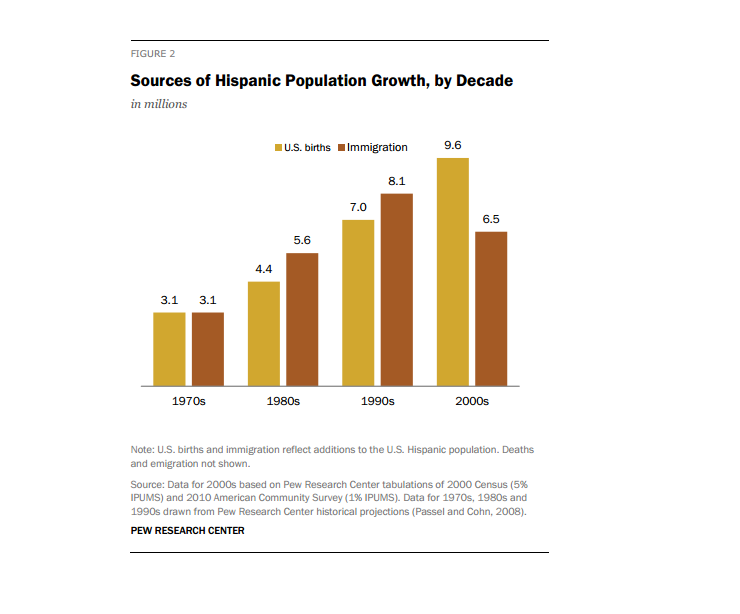
Latino Population Growth in US Driven by US births
The Latino population is the largest ethnic minority group in the United States, making up 17% of the current U.S. population, and projected to make up 31% of the 2060 population. However, the demographics within this community are slowly changing as Latino immigration stalls and U.S. born Latinos increase. In a new report from the Pew Research Hispanic Project that analyzed data from the 2012 American Community Survey, the rate of U.S. born Latino/as has surpassed that of non-U.S. born since 2000. The percentage of U.S. Hispanic immigrants was 35.5% in 2012 compared to 40% in the early 2000s.
Additional key findings that illuminate this trend include:
- In 2012, the five states where Hispanics make up the biggest share of the population are: New Mexico (47%), California (38%), Texas (38%), Arizona (30%) and Nevada (27%).
- There has been a 5% decrease in Hispanic headed households with five or more people and a 4% increase in two-person households from 2000-2012.
- Approximately 26% (12 million) of the Latino population (immigrant and U.S. born) aged 5 and above speak English at home exclusively. Among the 12 million, 39% among the U.S. born and 4% among the foreign born spoke English at home exclusively.
- Among those who reported speaking a language other than English at home, 56% reported speaking English very well.
- One-third of Latinos reported not speaking English very well.
- Approximately 48% of U.S.-born and 44% immigrant Hispanic household and are owner-occupied.
- As of 2012, approximately 50% of immigrant Latinos did not have health insurance, compared with 18% of native-born Hispanics. This percentage is even greater among immigrant Hispanics without citizenship (61%).
Though the report does not make any particular policy recommendations, policymakers can use this report in informing future policies that impact this community.
Joanne Chan, Joint Center Graduate Scholar, Harvard School of Public Health